Methods for Attenuation Coefficient Estimation
The ultrasound attenuation coefficient estimate (ACE) is a measure of ultrasound amplitude dissipation due to the combined effect of scattering and absorption. The accurate and objective estimation of the attenuation coefficient has important clinical implications. The accuracy of attenuation coefficient estimation (ACE) strongly influences the measurement accuracy of the other quantitative ultrasound parameters. In addition, the attenuation coefficient estimate (ACE) is independently used in the detection of different pathologic states. Large estimation bias and variance obtained using existing spectral based methods affects its clinical uptake. We have considered different approaches to overcome these limitations.
Attenuation Estimation Region of Interest (AEROI) selection Method
A current challenge in ACE computation is the presence of inhomogeneities in biological tissue that result in a large variance. We propose a new Attenuation Estimation Region Of Interest (AEROI) selection method where a homogeneous region-of-interest is identified [1]. We define two parameters as AEROI selection parameters: (i) envelope signal-to-noise ratio deviation (ΔSNRe) and (ii) coefficient of variation of the transmit pulse bandwidth (CoV(FWHM)). We showed that the proposed parameters can ensure the identification of a region where crucial assumptions of the reference phantom methods are satisfied.
Figure 1 illustrates the effect of applying AEROI selection criteria to an example placenta sample. The sample has appreciable inhomogeneity within the selected ROI. Evaluating ACE for all the AERs in the ROI results in a large estimate variance. From the attenuation map, we find that the outlying estimate values are caused predominantly by the inhomogeneities. The regions with outlying ACE values overlap with high AEROI selection parameter values in the \Delta;SNRe map or CoV(FWHM) map. Therefore, the AEROI selection criteria successfully remove the outlier values.
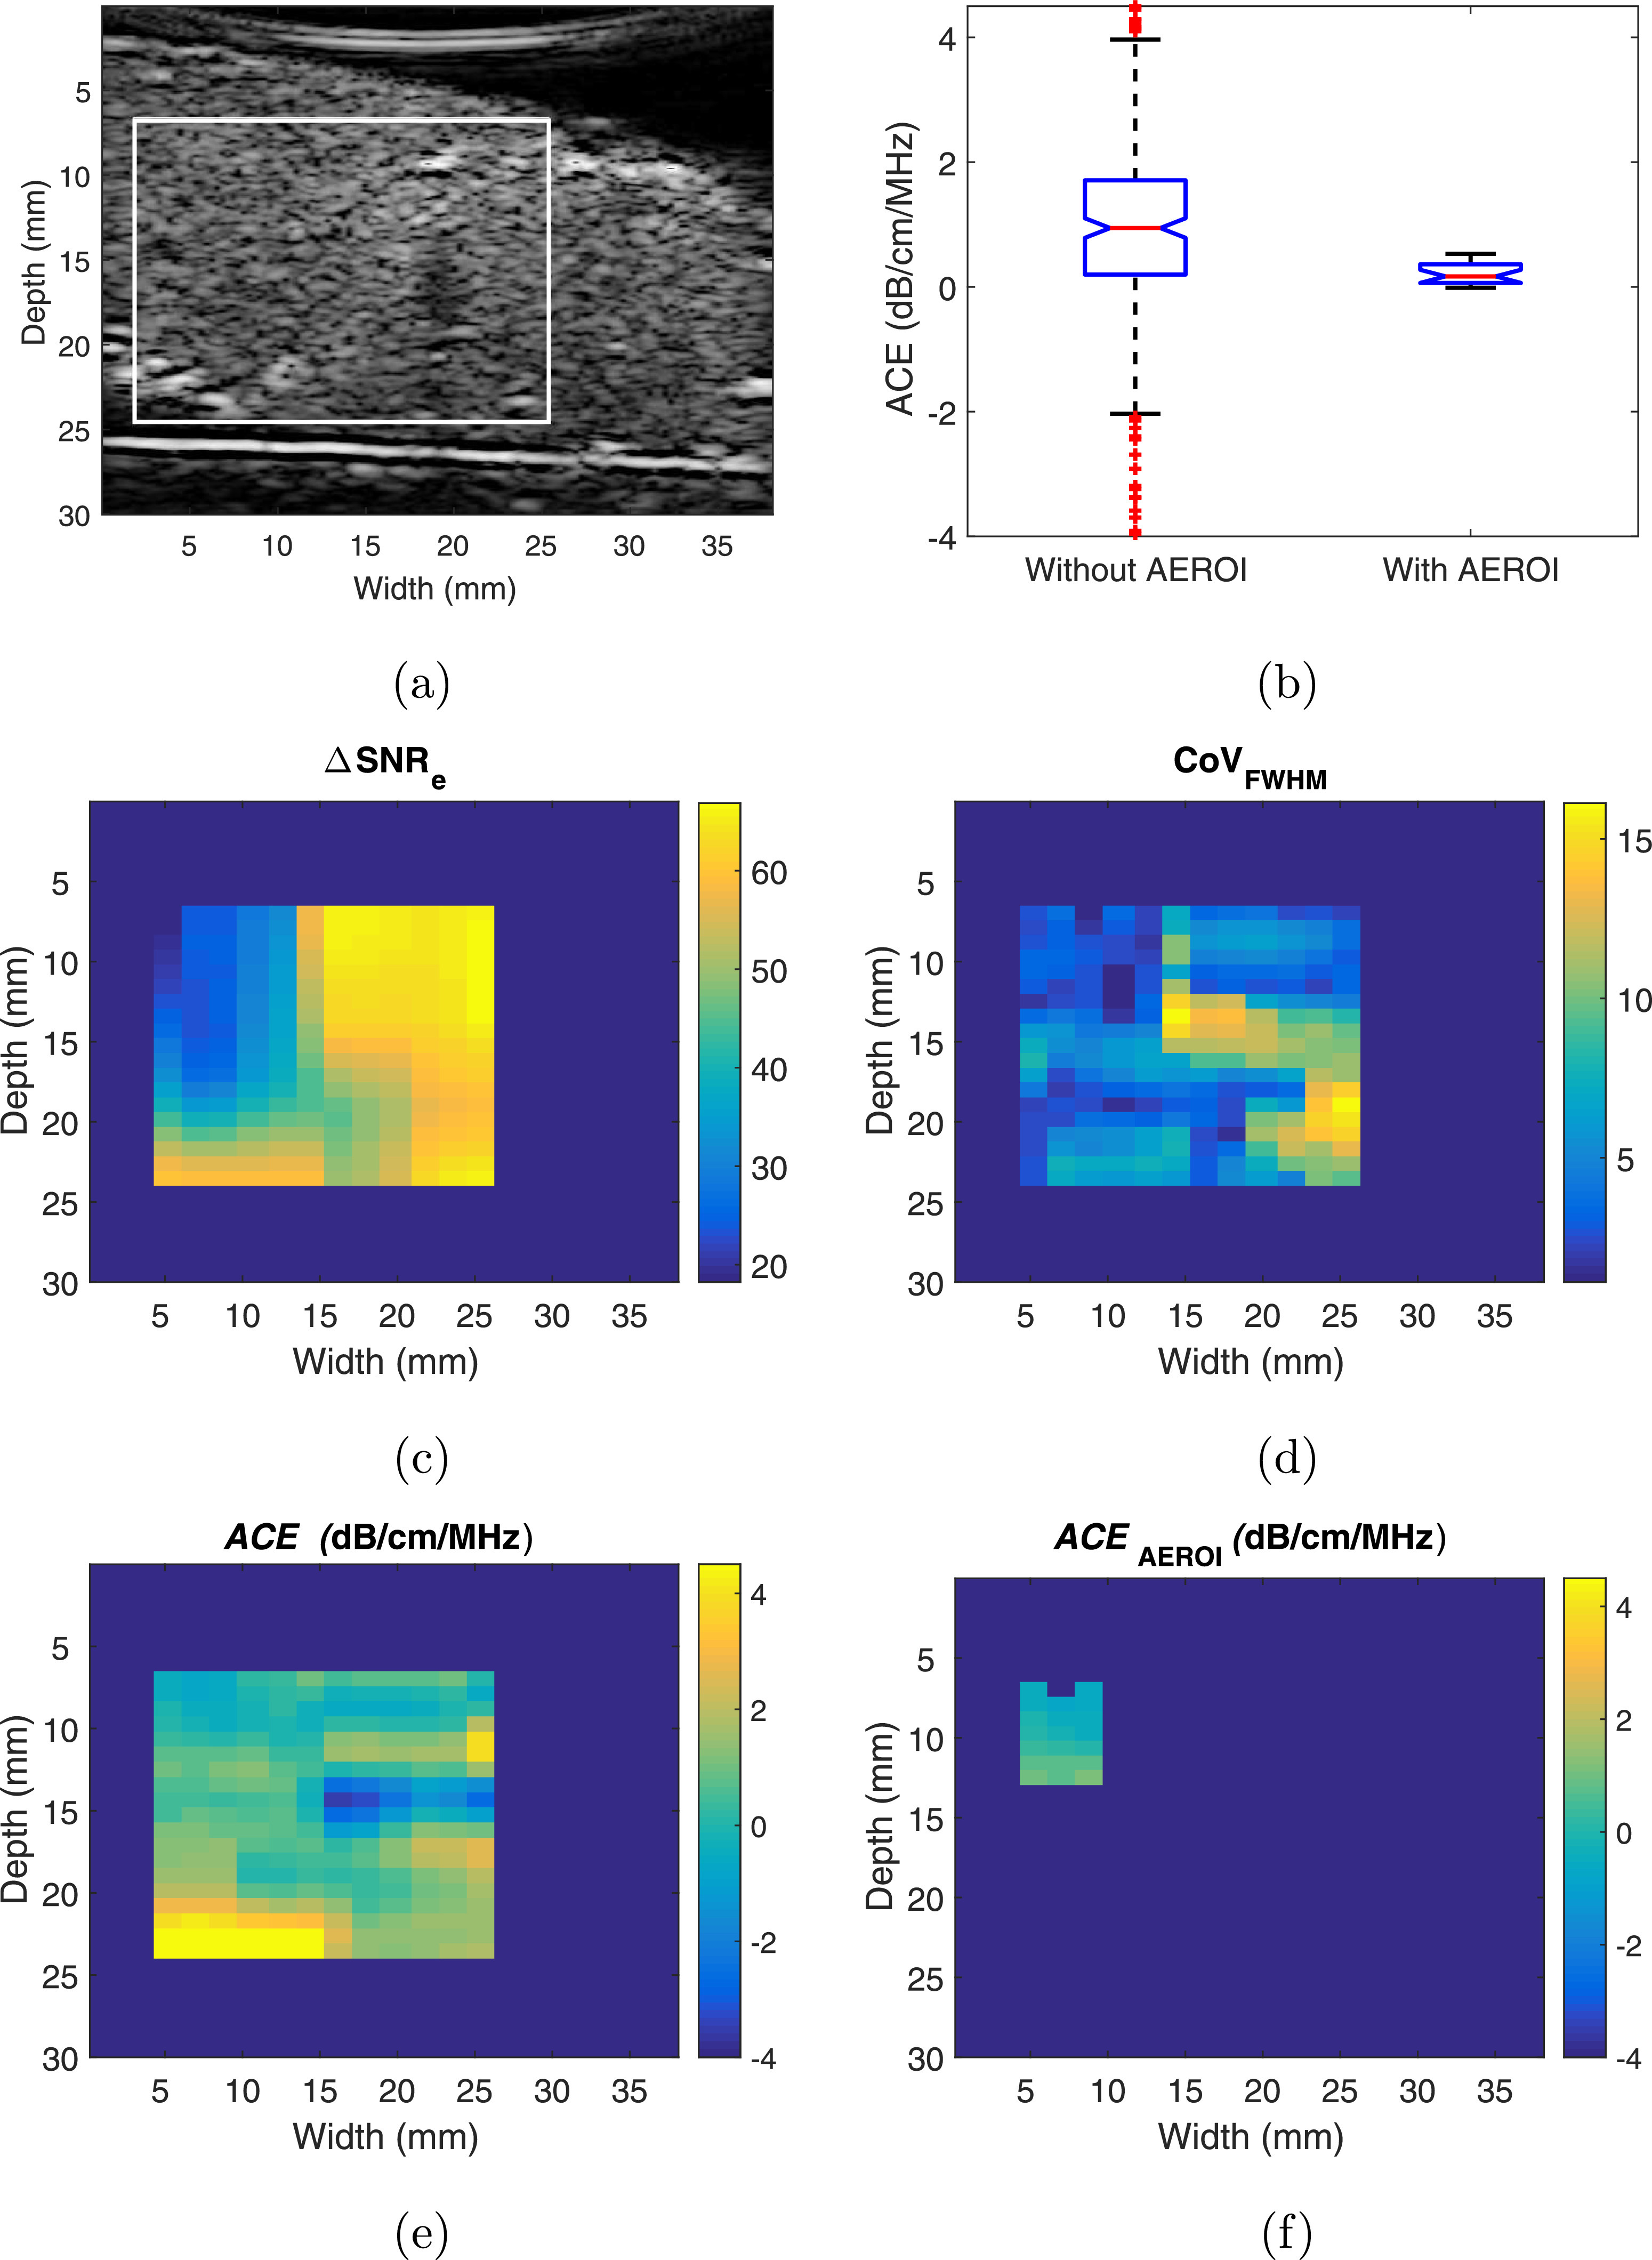
Figure 1: Effect of AEROI selection method on attenuation coefficient estimate error for a typical ex vivo placenta sample. (a) B-Mode image with ROI defining the maximum rectangular area containing placental tissue; (b) Box-and-whisker representation of the attenuation coefficient estimates before and after applying the AEROI selection method; (c) ?SNRe map for the selected ROI; (d) CoVFWHM map for the selected ROI; (e) Attenuation coefficient estimates in the ROI; (f) Attenuation coefficient estimates in the AEROI after applying the AEROI selection method.(bottom).
SWTV-ACE: A Spatially Weighted Regularization Based Attenuation Coefficient Estimation Method
Besides the presence of inhomogeneities in biological tissue, the fundamental trade-off between ACE resolution and precision causes the high estimation error and precision. Our previous work based on optimum region-of-interest (AEROI) selection yields significant improvement (46% reduction compared to the traditional reference phantom method). However, the resulting intra-subject standard deviation was still as high as 51% of the mean ACE. To address both these limitations, we propose a spatially weighted regularization method for ACE measurement, where the degree of regularization would be modulated based on the tissue inhomogeneity information [2, 3].
We demonstrate a feasibility analysis of the proposed method on RF data acquired from an ultrasound phantom (Model 040GSE) manufactured by CIRS (Norfolk, VA, USA). The phantom contains two different types of targets: scattering targets and gray scale targets (Fig. 2a). The scattering targets are made of nylon monofilaments and contain scatterers of different size, whereas the gray scale targets contain scatterers with a different density. As we plot the ?SNRe map, the targets can be distinguished with high ΔSNRe values (Fig. 1b). Ideally, the phantom has a uniform ACE value of 0.7 dB/cm/MHZ, and variable BSC values at the locations of the targets. Interestingly, computing the ACE and BSC using both the reference phantom and the uniform TV regularization yield high ACE errors at the target locations while both the methods fail to identify the variation in the BSC term (Fig. 1c). By applying the proposed spatially weighted TV regularization, the ACE error was significantly reduced, where the BSC term captures the backscatter variation at the target locations (Fig. 2d).
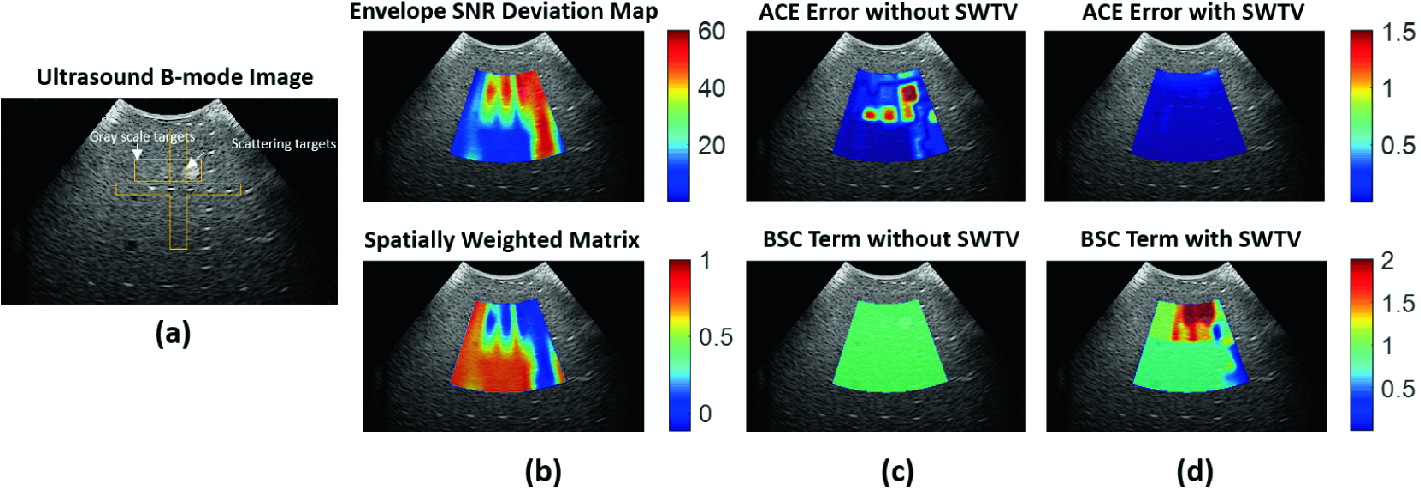
Figure 2: Feasibility test of the proposed SWTV-ACE method on a tissue-mimicking phantom. (a) Ultrasound image of the phantom with backscatter variation; (b) Spatially weighted matrix formation as a function of the envelope SNR deviation map; (c) & (d) ACE and BSC results with and without SWTV.
PredictUS: A Deep learning Method for Quantitative Ultrasound Image Reconstruction
ACE and other QUS parameters are measured using spectral based methods. The power spectral estimation, typically obtained from FFT based periodogram of windowed RF signal, imposes the fundamental trade-off between image resolution and estimation precision. Smaller windows provide high spatial resolution, a desirable property for many imaging applications such as characterization of thin (e.g. human skin) or heterogeneous (e.g. placenta) tissue. However, smaller windows yield noisy and inaccurate power spectra estimates due to limited spectral resolution and spatial variation noise inherent in ultrasonic scattering. Larger windows improve accuracy and precision of power spectra estimates and therefore the estimation of QUS parameters, with an expense of reduced spatial resolution. We propose an alternative method 'PredictUS', where a WaveNet inspired sequence-to-sequence convolutional neural network (CNN) is employed to increase the window size. In this method, the next data points will be predicted, given a fixed sized window. The method provides better estimates of local tissue properties with high resolution by virtually extending the property to a larger region.
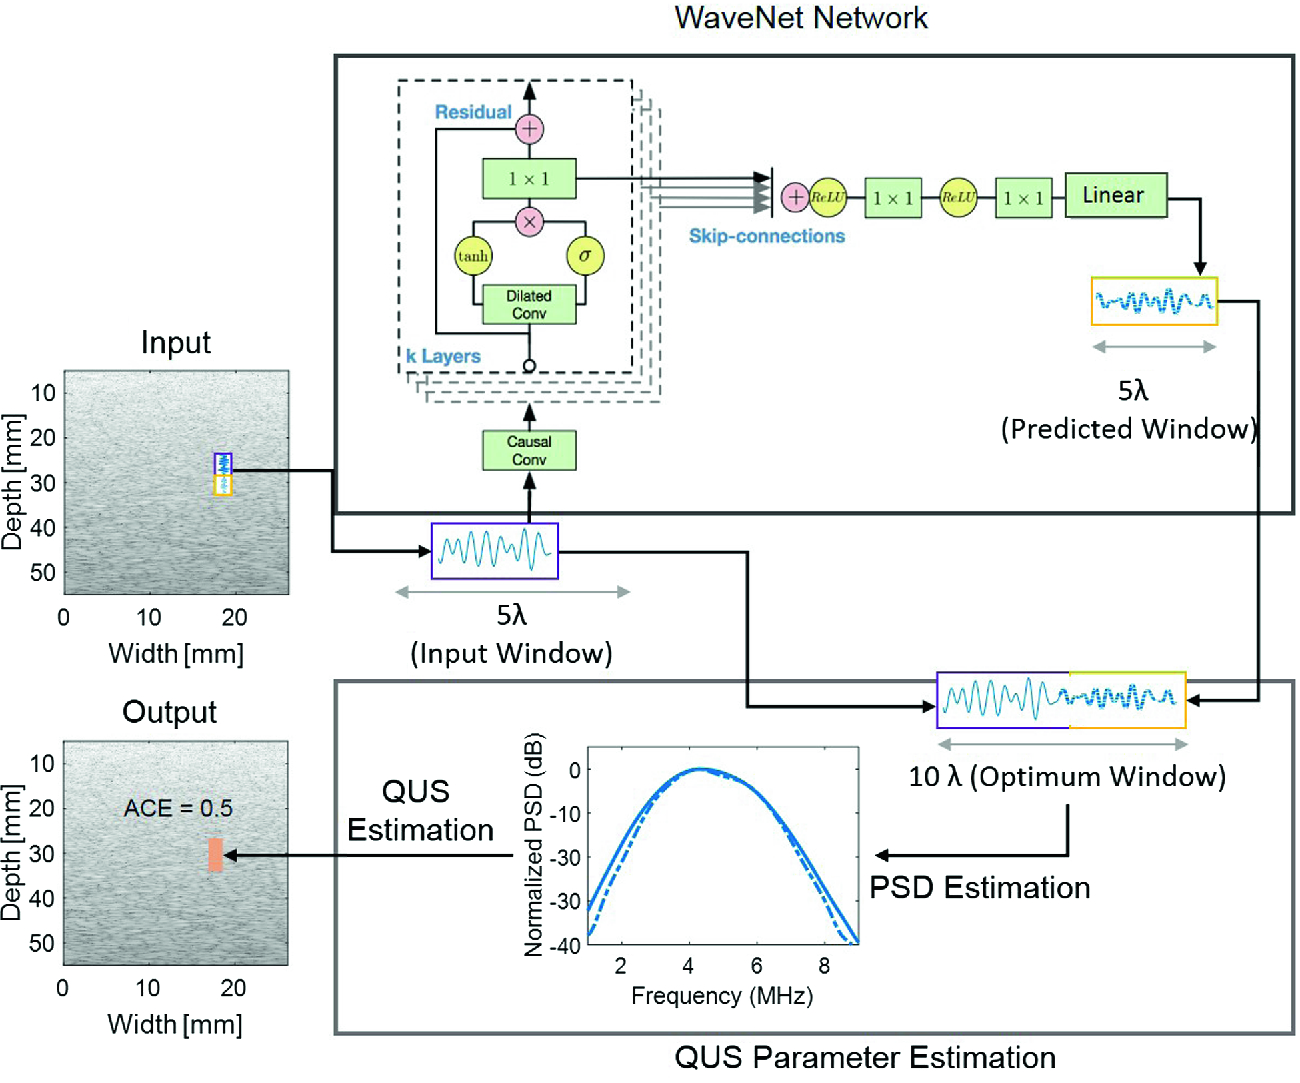
Figure 3: Overview of the proposed PredictUS method. Blue solid line indicates the original input window, whereas the blue dash-dotted line indicates the predicted signal in the “WaveNet Network” block and the power spectrum obtained from the optimum (i.e. PredictUS) window in the “QUS Parameter Estimation” block.
Compared to the optimum trade-off, the PredictUS method can reliably maintain similar precision and accuracy while improving the resolution to 75% of the optimum value. Moreover, the proposed method can still achieve comparable precision and accuracy for low ACE values with a resolution improvement of 50%. However, reducing the resolution to 25% of the optimum exhibit degraded ACE measurement, which can be attributed to the error accumulation in the n-step ahead prediction.
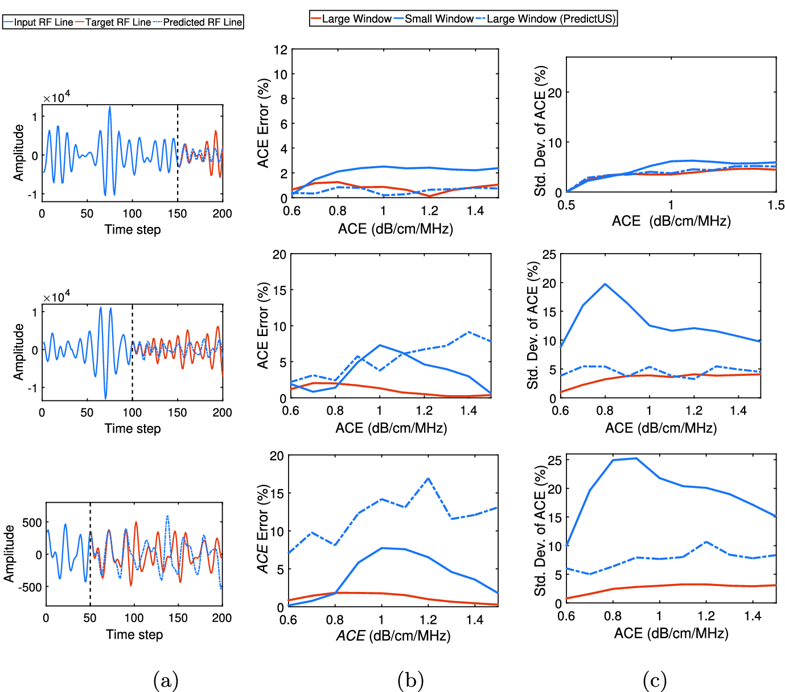
Figure 4: PredictUS performance for case I (top), case II (middle), and case III (bottom). (a) Example RF line segments and their divisions; (b) ACE error for different ACE values; (c) Standard deviation of ACE for different ACE values.
1. Deeba, Farah, et al. "Attenuation coefficient estimation of normal placentas." Ultrasound in medicine & biology 45.5 (2019): 1081-1093.
2. Deeba, Farah, et al. "SWTV-ACE: spatially weighted regularization based attenuation coefficient estimation method for hepatic steatosis detection." International Conference on Medical Image Computing and Computer-Assisted Intervention. Springer, Cham, 2019.
3. Deeba, Farah, et al. "A Spatially Weighted Regularization Method for Attenuation Coefficient Estimation." 2019 IEEE International Ultrasonics Symposium (IUS). IEEE, 2019.
4. Deeba, Farah, and Robert Rohling. "PredictUS: A Method to Extend the Resolution-Precision Trade-Off in Quantitative Ultrasound Image Reconstruction." International Workshop on Machine Learning for Medical Image Reconstruction. Springer, Cham, 2019.